[Prometheus] Exporter 추가 방법
<잘못된 방식>
additionalScrapeConfigs:
  - job_name: <DCGM service name>
    kubernetes_sd_configs:
      - role: endpoints
이전에 이런식으로 dcgm exporter를 추가해 metric을 수집하라고 했지만 kubernetes cluster내에 있는 모든 pod의 endpoint에 metric을 찾을 수 없다는 not found(404) 에러가 발생하는것을 보고 잘못된 방식이라고 느끼고 다른 방식으로 메트릭을 수집할 수 있는지 알아보았다. 그후 가장 좋은 방법을 찾아 공유하려고 합니다.
서비스모니터(ServiceMonitor)란?
Prometheus에서 ServiceMonitor는 Kubernetes 클러스터에서 서비스(Service)를 모니터링하기 위한 사용자 정의 리소스(Custom Resource)입니다. Prometheus는 ServiceMonitor 리소스를 통해 대상 서비스의 메트릭을 수집합니다. ServiceMonitor는 어떤 서비스의 어떤 엔드포인트를 모니터링할지, 어떤 포트와 경로에서 메트릭을 수집할지 등을 정의합니다.
ServiceMonitor의 주요 구성 요소
- 메타데이터(metadata):
- name: ServiceMonitor의 이름.
- namespace: ServiceMonitor가 속한 네임스페이스.
- spec:
- selector: Prometheus가 메트릭을 수집할 서비스를 선택하기 위한 라벨 셀렉터.
- endpoints: 메트릭을 수집할 엔드포인트(포트, 경로, 스크랩 간격 등)를 정의.

이해하기 쉽도록 다른 블로그에 있는 service monitor 이미지를 가져왔습니다.
메트릭의 엔드포인트를 바라보는 service가 있고 해당 서비스를 바라보는 servicemonitor가 있습니다.
프로메테우스에서는 CRD를 구성하여 해당 서비스 모니터에서 메트릭을 수집해온다고 생각하면 이해하기 쉬울것 같다.
kube-prometheus-stack helm chart에서 해당 서비스 모니터를 추가하는 방법에 대한 예시입니다.
prometheus:
  prometheusSpec:
    additionalServiceMonitors:
      - name: dcgm-metric
        selector:
          matchLabels:
            app.kubernetes.io/name: dcgm-exporter
        endpoints:
          - port: /metrics
            path: /metrics
위와 같이 value.yaml을 구성하여 배포하면 되는데 해당 port나 path 및 label 값은 배포한 service monitor의 describe를 통해서 확인이 가능하다.
직접 개발한 custom exporter를 제외하곤 모든 exporter가 ServiceMonitor가 같이 배포될 가능성이 높으니 확인해보면 좋다.

노란색 박스로 표시된 곳에서 value.yaml에 입력해야할 정보들을 확인 할 수 있다.
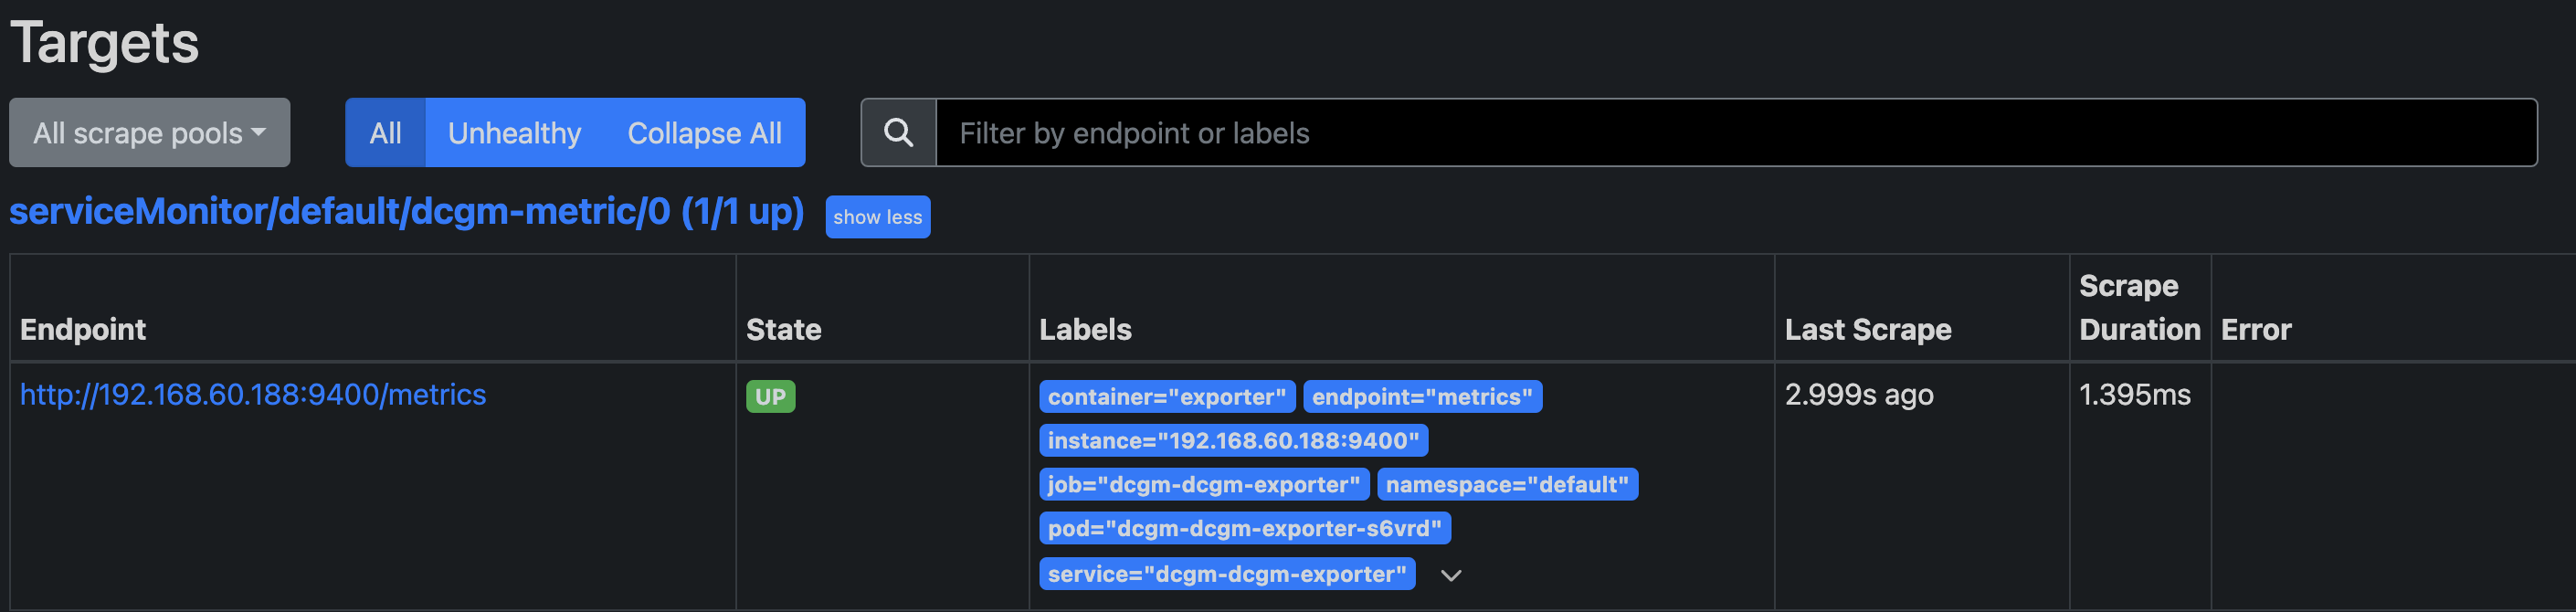
prometheus UI의 target에서도 서비스 모니터가 정상적으로 연결되었는지 확인 할 수 있다.
ref
Comprehensive Beginner’s Guide to Kube-Prometheus in Kubernetes: Monitoring, Alerts, & Integration
Master Prometheus in Kubernetes: Learn to monitor, set alerts, integrate Slack, and more in this detailed guide for robust cluster…
medium.com